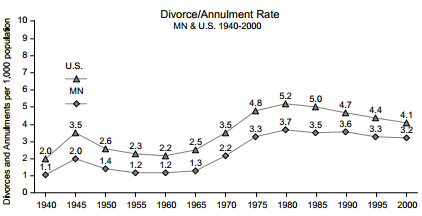
The number of Minnesota divorces and annulments has been steady in recent decades, after an increase in the 1970s. The rate when compared to the number of people in Minnesota has been trending slightly downward.
The first graph is the total number of marriages and divorces, not the rate per thousand, and a larger number can be expected when there is a larger population. However, the doubling in total divorces during the 1970 to 1980 decade seems higher than can be explained by the population growth (from 3,806,103 to 4,075,970).
The upward leap in the 1970s may be due to the appearance of no-fault divorce. California adopted the first no-fault divorce law in 1970, and over the following decade most states created no-fault divorce laws. All fifty states had such in 2010, when New York’s law took effect.
The rate for each thousand people in Minnesota during sixty years has ranged from 1.1 to 3.7, with the rate having a similar change as the total count of divorces during the 1970s.
These graphs are from a 2002 state legislative study. The Centers for Disease Control was not getting enough data from Minnesota, and stopped trying to estimate the state’s divorce rate after 2004.


